

Quick Guide to Creating a Contour Map
Introduction
A contour map serves as a valuable tool for visualizing the Earth's surface in two dimensions, effectively depicting elevation changes. Popular among civil engineers, geographers, and outdoor enthusiasts, these maps employ contour lines to represent points of equal elevation. Unlike Google Earth, which provides a three-dimensional perspective, contour maps offer a flattened yet informative view, making them ideal for planning, analysis, and navigation in various fields.
Understanding Contour Maps

Imagine looking down at a mountain range from above. Instead of seeing the peaks and valleys in their full three-dimensional glory, a contour map represents these features using lines. Each of these lines, called contour lines, connects points of equal elevation.
In essence, if you were to walk along a single contour line, you would neither ascend nor descend; you would remain at a constant height above sea level. The beauty of a contour map lies in its ability to convey complex terrain information through this elegant system of lines, making it an indispensable tool for understanding the shape and elevation of the Earth's surface.
The Basics of Contour Lines
Contour lines are the heart of a contour map, acting as visual guides to understanding elevation changes. Each line represents a specific elevation relative to a reference point, typically sea level. As you move from one contour line to another, you are essentially ascending or descending the terrain.
The spacing between contour lines reveals the steepness of the slope. Closely spaced lines indicate a steep incline or decline, while widely spaced lines represent gentler slopes. This pattern of proximity and distance allows for an intuitive understanding of the land's topography.
Contour lines never intersect, as a single point cannot have two different elevations. They either form closed loops, indicating hills or depressions, or run off the edge of the map, suggesting that the terrain continues beyond the depicted area.
Significance of Contour Intervals in Mapping
The contour interval is a crucial element of a contour map, representing the vertical distance between adjacent contour lines. It determines the level of detail displayed on the map. A smaller contour interval, for example, 10 meters, results in a denser network of lines, revealing subtle elevation changes.
Choosing the appropriate contour interval depends on the scale of the map and the characteristics of the area of interest. A large-scale map covering a small area with significant elevation changes might require a smaller contour interval. Conversely, a small-scale map depicting a relatively flat region could utilize a larger contour interval without sacrificing clarity.
Digital elevation models (DEMs) serve as valuable datasets for determining the contour interval. By analyzing the elevation data within the DEM, mapmakers can select an interval that accurately represents the terrain while maintaining readability.
Steps to Create Your Own Contour Map
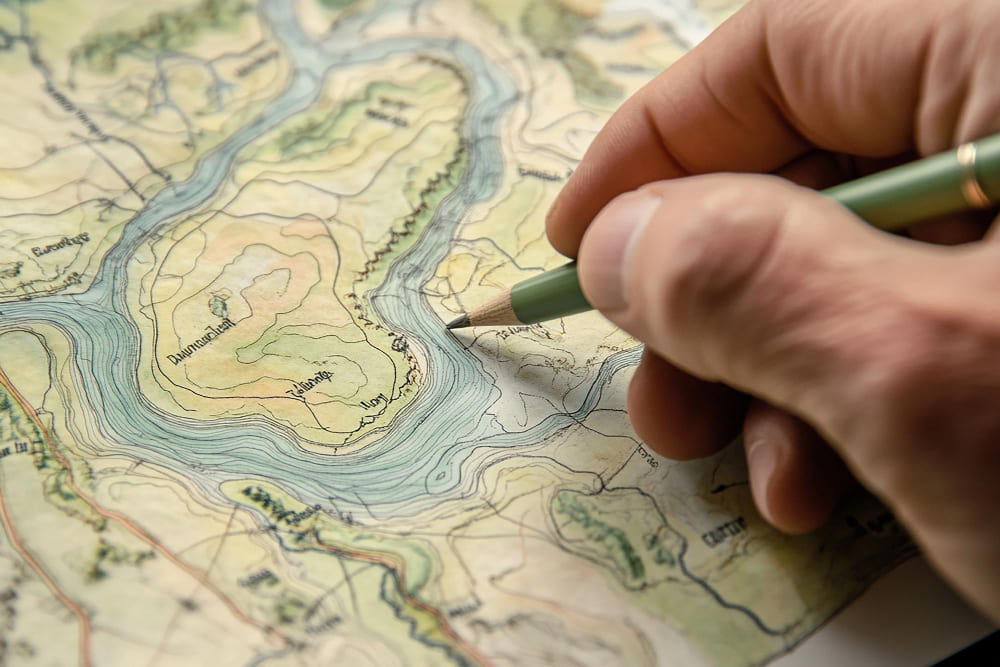
While creating a contour map traditionally involved surveyors painstakingly measuring elevations, advancements in technology have made the process significantly more accessible. Today, anyone with access to a digital elevation model (DEM) and the right software can generate their own contour maps.
This digital revolution has opened up new possibilities for understanding and representing terrain, empowering individuals and professionals alike to explore the Earth's surface in greater detail. Let's explore the steps involved in creating your own contour map.
Gathering Data for Contour Mapping
The foundation of any accurate contour map rests on reliable elevation data. Thankfully, numerous resources offer free and readily available digital elevation models (DEMs). These datasets contain a grid of elevation values, providing the raw material for generating contour lines.
One convenient option for obtaining DEM data is through the Google Elevation API. It allows users to query specific locations and download elevation data in various formats. Alternatively, numerous websites offer pre-processed DEMs for different regions, ready to be imported into mapping software.
Data Source Description Google Elevation API Offers elevation data for individual points or areas via API requests. USGS National Map Provides access to a wide range of geospatial data, including DEMs, for the United States. JAXA ALOS World 3D Offers global DEM data at 30-meter resolution, particularly valuable for large-scale mapping.
These are just a few examples; explore different options to find the best data source for your specific area of interest.
Tools and Software for Contour Mapping
Once you've acquired the necessary elevation data, the next step is to choose the tools and software that best suit your needs. Fortunately, numerous options cater to different skill levels and budgets.
For those seeking a user-friendly approach, various online contour map generators and apps are available. These platforms simplify the process, allowing you to upload your DEM and customize the appearance of your map with ease.
For more advanced users, Geographic Information Systems (GIS) software, such as QGIS or ArcGIS, provides powerful tools for creating and analyzing contour maps.
- These programs offer greater flexibility in terms of data manipulation, analysis, and output formats.
- They support various data formats, including DEMs in formats like GeoTIFF or ASCII grid.
- Generate contour lines, hillshades, and other terrain visualization products. Additionally, you can export your final contour map in various formats, such as JPEG, PNG, or even as a scalable vector graphic (SVG) file.
Conclusion
Creating contour maps can be a rewarding experience in understanding landscapes. By mastering the basics of contour lines and intervals, you can accurately depict terrain features. Utilizing tools and software for mapping enhances precision. Remember, gathering data is crucial for an informative map. Whether for educational purposes or professional use, contour mapping provides valuable insights. Embrace the challenge of creating your own contour map to enhance your mapping skills. Explore the FAQs to deepen your knowledge further and become proficient in reading and interpreting contour lines effectively. Start your contour mapping journey today!
Frequently Asked Questions
What is the easiest way to read contour lines?
Focus on the contour interval, which reveals the elevation difference between lines. Closely spaced lines indicate steep slopes, while wider spacing represents gentler terrain. Imagine you're moving from Canada toward the equator on the map; if the contour lines show increasing elevation numbers as you head south, you're climbing uphill.