How to Read a Contour Line Map Like a Pro
Introduction
Have you ever seen a hiking map and found those curvy lines on it? These lines are called contour lines, and they help you know the shape of the land. If you learn how to read these lines on topographic maps, you can better understand the land in the United States or any other place. With this guide, you will learn everything you need. You will get the basic ideas and also how to read those lines better. With practice, you can read any hiking map and go anywhere with more confidence. Start now, and get ready to read your topographic maps like a pro.
What Is a Contour Line Map?
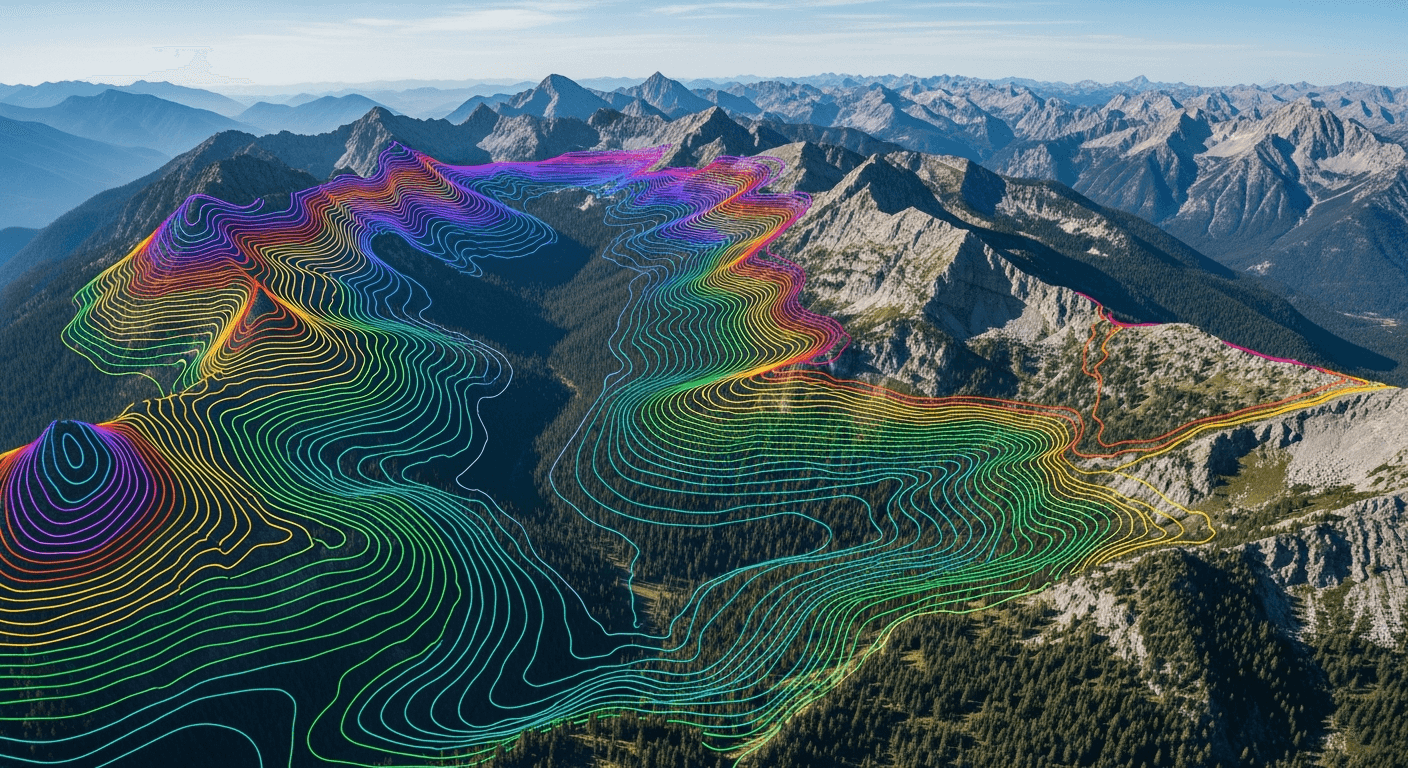
A contour line map, also known as a topographic map, uses lines to show how the land goes up and down. These lines are called contour lines. Each one connects points of equal elevation. If you walk along one contour line, you stay at the same height. You would not be walking up or down.
These maps are very helpful tools for people in the United States who want to know about the land. Contour maps show how the land goes up and down on a flat page. They let you see hills, valleys, and slopes before you go out there.
Definition and Key Features of Contour Lines
The main idea behind contour lines is that each line shows points of equal elevation. It is like if you cut a mountain into several flat layers. The edge of every layer is a contour line. When you look at contour maps with these lines, you can see the height and shape of the land compared to sea level.
You will see different types of lines on these maps. Index lines are thick and are usually marked with their height above sea level. Between these, there are thinner lines called intermediate lines. In some flat places, you can find extra lines called supplementary lines. They often look like dotted lines and help give more detail. All these map symbols help you get a good view of the land.
Understanding these features is the first thing you have to do to read contour maps well. These lines help you see the elevation profile of your terrain. It is important for things like planning a hike or dealing with a big building job. The lines on a contour map show you more about the land. If you learn how to read them, you will get better at finding your way.
Common Uses for Contour Line Maps in the United States
Across the United States, contour maps help many people in different jobs and hobbies. A topo map shows the shape of the land, so anyone who wants to know how the land goes up and down can use it. Hikers use these maps to pick their path. Engineers also use contour maps when making new roads. These maps give important details about the land.
Land surveyors, geologists, foresters, and miners use the detailed elevation data to help them do their jobs in a safe and sure way. For people who love the outdoors, these maps are important too. A map can help you pick your path or help you get out in a hard spot if you are in a place you do not know.
Here are some usual uses for contour maps:
-
Planning hiking, backpacking, or hunting paths
-
Studying rocks and the land around us
-
Measuring land and making plans for towns
-
Getting stuff from the ground, like mining
-
Helping in emergencies or when people get lost
Understanding How Contour Lines Are Drawn
Have you ever thought about how the lines end up on the map? Contour lines show height because they join points of equal elevation. In the past, people had to go outside and measure these points by hand. It took a lot of time and hard work. Now, it is done much faster with new tools. Aerial photos and satellite pictures like LiDAR help make contour lines more correct and easy to use.
This data collection helps to make a clear picture of the Earth's surface. Map makers use certain software for this. With it, they draw lines that follow places with the same height. This is how we get contour maps. Now, let us look at the ideas behind how this is done and see how height data turns into the lines you find on your map.
Principles Behind Generating Contour Lines
The main idea of making contour lines is to link points of equal elevation. Every spot you see on one contour line will be at the same height above sea level. This way, you turn a 3D landscape into a 2D map that is easy to read and understand.
These lines are set at the same up-and-down space from each other to help you use the map. This space between lines is called the contour interval. For example, when the contour interval is 40 feet, you will see a new line every time the land goes up or down by 40 feet. The same space between lines helps you know how steep a slope is.
Each contour line shows a set height that does not change. So, contour lines do not merge or cross. There is one time when this can happen. It is on a straight-up cliff. Here, a few lines may seem to come together. This rule is a must for showing what the land looks like with contour lines on maps.
How Elevation Data Translates Into Lines on a Map
The path from raw data to a finished map has many steps. First, people gather elevation data from a region. They use ways like ground surveys or tools on airplanes to do this. This gives a big group of points. Each point has a specific elevation number. In the United States, groups like the USGS are often in charge of this data.
Next, cartographers or software look at the information. They find every spot that has a specific elevation. Then, they use a smooth line to connect these points. They do this for each contour interval shown on the map. For example, they connect all the points at 1,000 feet. After that, they do the same for 1,040 feet, and so on.
The result is a set of lines that are the base of contour maps. Every line shows a clear height. This helps you see how the land looks in three dimensions.
Feature on Map What It Represents in Reality How Data Is Translated Index Line (Thick) A major elevation marker A line drawn at a round-number elevation (e.g., 1,000 ft) and labeled. Intermediate Line (Thin) A step in elevation between index lines Lines drawn at the specified contour interval (e.g., 1,020 ft, 1,040 ft). Close Line Spacing A steep slope or cliff Many data points showing a rapid change in elevation over a short horizontal distance. Wide Line Spacing A gentle slope or flat area Data points showing a slow change in elevation over a long horizontal distance.
Contour Line Maps vs. Topographic Maps
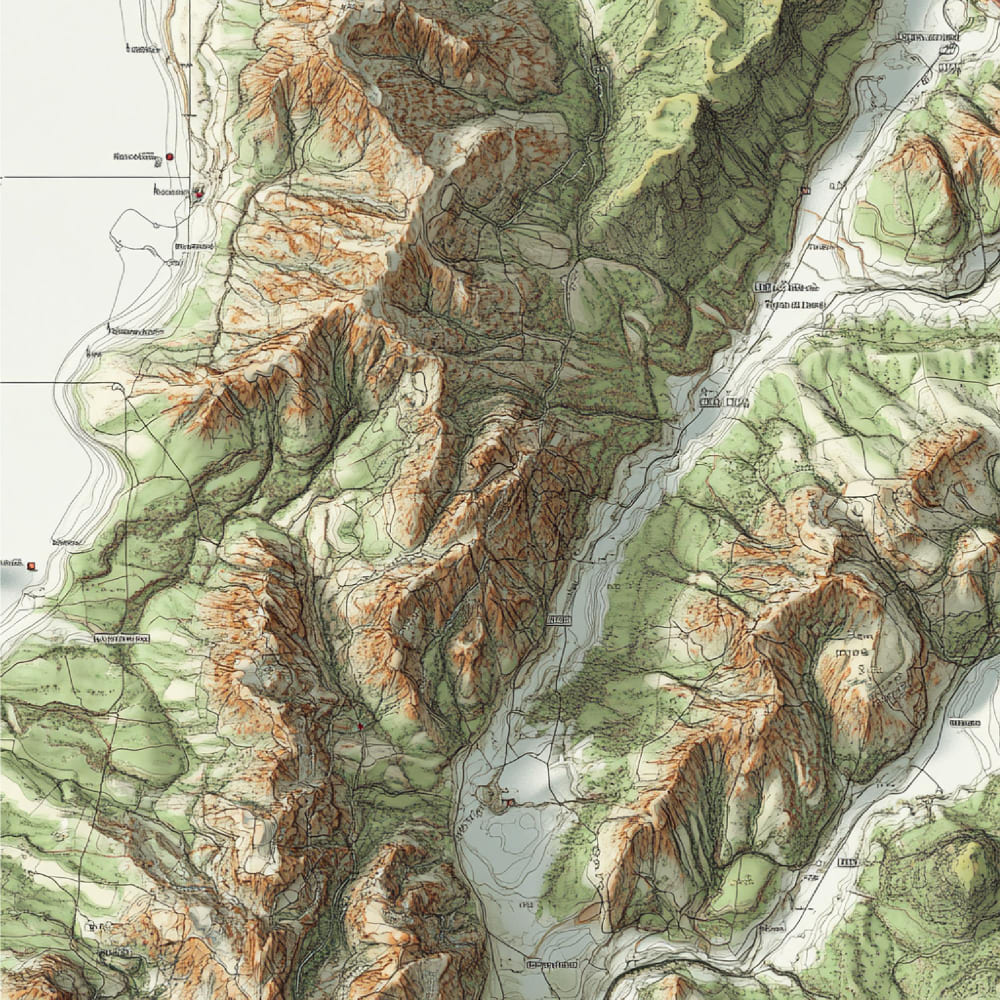
You will see people use the words "contour map" and "topographic map" to mean the same thing. That is because both show the land in a clear way. A map with contour lines on it is called a topographic map, or you might hear people say "topo map" for short. These contour lines are a big part of topographic maps. But topographic maps, or topo maps, also have other things to help you get more out of the map.
A simple contour map mostly shows lines for elevation. A full topographic map gives more detail. It uses colors, shading, and many symbols. You will see rivers, forests, roads, and buildings. Both maps help you see geographical features. Now, let's see how they are different and how they are the same.
Main Differences and Similarities
The main thing topographic maps and contour maps have in common is the use of contour lines. These lines show elevation. This is what both of these map types use to help you see how the land goes up and down. They both make it easy for you to picture a 3D land shape even though you are looking at a flat map.
The main difference is in how detailed they are. A true topographic map gives a lot more details. It shows many map symbols. You can find things like buildings and boundary lines on it. It also shows trees, grasslands, and lakes. A simple contour map usually just shows the lines for height and nothing else.
Think of it like this. When you use topographic maps, you are looking at contour maps too. But some contour maps do not give you all the details you need to call them real topographic maps. Topographic maps give you all the facts about the land around you. Contour maps mostly show the way the ground goes up or down.
When to Use a Contour Map or a Topographic Map
Choosing between a simple contour map and a full topographic map comes down to what you need. Sometimes, you only need to see the shape of the land and how it goes up or down. Other times, you want to see more, like all the roads, trails, and places where you can find water.
For example, a geologist who looks at a landform might need a good contour map. But a hiker who wants to do a trip for several days in the United States will find a topographic map is better. This is because the map has not only the kinds of contour lines, but also shows trails, campsites, and rivers. A hiker needs to see all of these on the map. A topographic map in the United States helps you look at the kinds of contour lines and other key things on a hike.
Here's a simple guide for when to use each:
-
Use a simple contour map for: Looking at land shapes, doing science work, or studying basic elevations.
-
Use full topo maps for: Going hiking, finding your way outdoors, checking land for measuring or building, making plans for safety, and choosing ways to get around that need trails or roads.
-
For most recreational uses: A topo map is the best and most useful choice.
How to Read and Interpret Contour Lines
Once you know what contour lines are, the next thing is to learn how to read them. A look at these lines on topo maps can show you a general idea of the landscape. If the lines are close together, or if they are far apart, that can tell you how steep the ground is. This simple tip helps you know more about the area you are looking at.
When you look at the way these lines go, you can find out what the land looks like and get to know the height changes. Each spot you see on one line is at the same height. We will next talk about how to read these lines to spot slopes. You will also learn to find key spots like high points and low points.
Decoding Line Patterns for Steepness and Slope
The space between contour lines tells you how steep the land is. If each line stands for the same elevation difference, changes in the slope show up as inconsistent line spacing on the map. This helps you see what the ground really looks like.
When you see contour lines very close to each other, this shows a very steep part of the land. The elevation change is fast in a short space. When contour lines are far apart, it means the ground has a gentle slope or is mostly flat. The elevation change there is slow and easy to see.
Here is a fast way to check the degrees of steepness:
-
Very close lines: These show that the land is like a cliff or has a very steep slope.
-
Moderately spaced lines: These show a hill that you can go up. The slope is steady and you can walk it.
-
Widely spaced lines: These show the land is flat or the slope is soft.
-
Evenly spaced lines: These mean the slope will stay the same all the way.
Identifying Peaks, Valleys, and Landforms
Contour maps do more than show how steep the ground is. The maps also show different land shapes using clear patterns. If you learn these patterns, you can read a map faster. A peak often looks like several concentric circles or ovals on the map. The inner ring shows the highest elevation, which means the top of a hill or mountain. You may also see an 'X' at the summit to point out the exact spot at the top.
Valleys and streams show up on the map as V- or U-shaped contour lines. There is an important rule you should know. The tip of the 'V' always points uphill, toward where the water comes from. This is called the "Rule of V's". It helps you understand which way a stream goes. Just remember, water always flows downhill. So, water will move away from the point of the V. This can help you read contour lines on a map.
Other common things you will see are saddles, which sit between two high points and look like an hourglass. Ridgelines are easy to spot because they show up as long, U-shapes or ovals. If you learn how to see these shapes on contour maps, you get a strong skill. It helps you read the land and pick the best way to go.
Contour Intervals: What They Mean and Why They Matter
The contour interval is a key thing you need to know when you read a topographic map. It shows you how much difference there is in height, or elevation, between any two contour lines next to each other. For instance, if the contour interval is 20 feet, each time you move from one of the lines to the one next to it, you go up or down 20 feet from sea level. This helps people see and understand the change in height, or elevation difference, around on the map.
If you do not know the interval, the interval lines will just look like squiggles. But if you have the interval, you can find out the real height of hills and how deep the valleys are. This will help you understand how much you need to climb or go down. Let's see how to spot this value on your map and how to use it the right way.
How to Find and Use the Interval on Any Map
Finding the contour interval is often easy. Check the map key, which you can find at the bottom of the map. The map key will show the contour interval, usually close to the map's scale. You might read something like "Contour Interval 40 feet" written there.
Once you know the contour interval, you can tell the height at any point in between. First, look for the nearest index line. This is the thick, labeled line. Then, count how many interval lines are between where you are and the index line. Multiply that number by the contour interval. This will give you the total elevation change.
Here's how to put it into practice:
-
First, look for the contour interval in the map key.
-
Next, find the nearest index line that is marked with a number to your place of interest.
-
Then, count the contour lines from the index line to your spot.
-
After that, take the number of lines and multiply it by the contour interval.
-
Now, add or take away this number from the index line's height. Do this based on if you go uphill or downhill.
Real-World Examples of Interval Interpretation
Let's say you are looking at a map, and the contour interval is 50 feet. You see a trail that goes across five contour lines in one mile. This means you will go up 250 feet of elevation on that mile (5 lines x 50 feet each). This can tell you what the climb will be like on the trail.
Here is another example that can help you see how to judge steepness. If those same five lines are crossed in only a quarter of a mile, the climb is much steeper. This is a good way to see which route will be harder. A great resource for planning is to look at how many feet you go up for each mile. If you get over 1,000 feet up per mile, it will be very steep.
Knowing the contour interval can help you understand some examples of grades. A 10% grade means you go up 10 feet of elevation for every 100 feet you move forward. Home stairs have a grade of about 40%, which is very steep. A wheelchair ramp is usually around a 5% grade. The contour interval is the main thing you need to use for these kinds of calculations.
Digital Tools and Online Resources for Viewing Contour Line Maps
Paper maps will always have their place, but digital tools have changed the way we use contour maps. There are apps and websites with good features. Some of these help you see 3D views, plan your route, and add contour lines over satellite images. A tool like Google Earth lets you move through a landscape and look at the land in three dimensions.
Many of these resources are free. You get detailed maps from places like the United States Geological Survey (USGS). You can look at land maps right on your computer or smartphone. There is no need to leave your home to do this. Now, we will look at some of the top online map viewers and tools available.
Finding Free Online Map Viewers and 3D Visualization Tools
There are a lot of good free tools you can use to see and work with contour maps online. These tools are helpful if you are someone who makes maps or just looking around. For example, google maps has a "Terrain" layer. With it, you can view contour lines and shaded land, so you get a quick idea about the area's shape and the land.
If you want more features, Caltopo is a good tool you can use in your browser. It lets you make changes to your maps, like adding layers and drawing routes. The National Map is another option from the USGS. It gives you a lot of official U.S. topographic data. Many of these sites also give you great 3D tools, so you can see the land in a new way.
Here are some top digital tools to explore:
-
Google Earth: You can use this to see your routes in strong 3D on its satellite maps.
-
Caltopo: This free map site lets you plan and print maps your way right in the browser.
-
Gaia GPS: This is an elegantly designed map program for your phone. You can get maps and use them even when you are not online.
-
The National Map: This is the place to get official topographic maps from the U.S. government.
Ways to Export, Download, and Create Your Own Contour Line Maps
Many sites let you do more than just look at contour maps online. You can make your own map. After this, you can download or export the map for your use. People use these maps for hiking, work plans, or any area they like. You can also save a map to use it without the internet or print it. For example, you can make a path and save it as a KML file to see later in Google Earth.
You can find data for the united states from places like the United States Geological Survey (USGS). A lot of this information is easy for people to get and use. When you download this data, you can see and work with the real map data. You can get a simple picture or a more detailed file for your design needs. Both are there for you to use. Now, let's look at some top places in the united states to get this and check out the kinds of files you might see.
Popular U.S. Sources for Data and File Formats (SVG, Vector)
If you are in the United States and you need good map data, the federal government is a great place to start. The National Geospatial Program is handled by the USGS. It makes a lot of topographic info open to the public through its website, The National Map. You can get files to use in GIS tools or other apps.
When you need a file for a map, your choice will be based on what you want to do. If you just want something simple for normal use, you can get the map as a PDF or image. If you need the map for design or some work that has to do with a field like tech, you should look for vector file types. You will not always find SVG files ready to download, but you can often get data in formats like Shapefiles (SHP) or GeoJSON. Later, you can use GIS software to change these into SVG or other vector files.
Here are some key sources and formats:
-
The National Map (USGS): This is the main source for getting official topographic data for the U.S.
-
Caltopo: Here, you can make your own maps. You can save them as PDFs, image files, or as GPX/KML files for your GPS.
-
Vector Formats: Try to find your data in SHP or GeoJSON formats. You can use these in GIS apps.
-
State GIS Portals: A lot of states have their own GIS sites. These let you download map layers from the state.
Step-by-Step Guide to Downloading and Using Map Data
Getting your own contour maps is easy. You can use The National Map viewer from the USGS for this. First, go to the website and zoom in on the area you want. Then, use the tools there to pick the layers you like. These can include contour lines and water features, or hydrography.
Once you set the map view, look for where you can download. You will often see products ready for your area, like topographic maps in GeoPDF format. The files are good because you can use them in apps that show your spot on the map. This is because they are georeferenced.
After you download the file, you can print it out and use it as a field map. You can also put it on a mobile app like Avenza Maps. When you print the map, make sure to include the scale and the map key. This helps you have all the things you need, like the contour interval, right with you. This way, you get a custom map that is clear and useful for any trip you take.
Common Applications for Contour Line Maps
The uses for contour maps cover many things. People use them for fun and for important work. A hiking map with contour lines is a must-have if you go outdoors. It will help you see the land shape, stay safe, and pick a path that is right for you. A contour map helps you know the ground ahead and lets you choose a trail based on how fit you feel.
These maps are very important in the United States. People use them not just for hiking but also for work like land surveying, engineering, and studying rocks and dirt. Experts use these maps to help plan building jobs, take care of natural areas, and learn more about the land. Now, we will look at how people use these maps for these jobs.
Hiking, Outdoor Navigation, and Planning Routes
For people who hike or backpack, contour maps are very helpful. These maps let you see the elevation profile of your terrain before your trip. This can help you stay away from steep climbs that you do not want. You can also use them to find the best path through hilly areas. Trying to plan a hiking route without one is a lot like going somewhere without seeing where you are going.
By looking at the contour lines, you can tell how hard a trail will be. Is it a slow climb or a tough hike up? You can spot flat areas that are good for campsites. You can also find the fastest way over a saddle between two hills. This will help you a lot on any hike, from a short walk to a long trip like the Appalachian Trail.
Here's how contour maps help in the outdoors:
-
Check how steep the trail is.
-
Look for the easiest path to take.
-
Find spots where there is water in the valleys.
-
See where there are flat spaces to set up your camp.
-
Stay away from dangers like high cliffs.
Land Surveying, Engineering, and Project Design
In building and development, contour maps are a key tool. Land surveyors use them to make site plans with a lot of detail. These plans are important for any project design. Before work begins, engineers use contour maps to see what the land looks like now.
This information is important for many things. People use it to decide where roads will go and where to put buildings. For example, an engineer can look at a contour map and choose a road path that goes over easier terrain. This helps them avoid work that costs a lot and causes problems for the environment. The maps also help find solid ground, spot possible water problems, and see the smartest way to build for less money.
Without the correct elevation data from contour maps, there can be many risks and mistakes during large work planning. Contour maps give a simple and clear map of the land's highs and lows. This helps builders make sure what they put up is safe, good for the future, and fits well with the area around it.
Conclusion
To sum up, learning how to read contour lines on a map helps you find your way and see more. When you know what contour lines mean, you read the land better. This can help you plan a hike, measure land, or just enjoy what you see in nature. The skills you now have will make your time outside better. They will help you make good choices in many things you do. Pick up your map, feel ready for a trip, and see the land in a new way.
If you have questions or need help with contour lines and reading maps, you can ask for support. Happy mapping!
Frequently Asked Questions
How can I quickly tell the steepest part of a contour line map?
To spot the steepest part, you should find where the contour lines are closest together. When there is inconsistent line spacing, it shows that there is a quick elevation change in a short space. The contour lines packed tight mean a place with high degrees of steepness, like a steep hill or maybe even a cliff.
Where can I find free U.S. government contour maps?
You can get free official contour maps from the United States Geological Survey (USGS). The best place to go is The National Map viewer. This site is run by the National Geospatial Program. You can view and download many topographic maps and data there. This is a good way to find maps for the United States.
Can I use contour line maps for road trips or city navigation?
Topo maps are not great for getting around in a city. But, they can be good to use when you take a road trip. These maps give you a general idea of the landscape and the elevation profile of your terrain. You can get ready for steep hills or mountain roads before you even see them on a normal map.